Summary
This report intends to compare quality results from US origin soybean and Brazilian origin soybean. The information from the US is uploaded directly from the FGIS Public database. The information from Brazil is collected from different surveyors. The quantities specified represent available information. It does not include all soybean exports but represents a significant portion.
This week, as usually, we continue comparing monthly quality from US and Brazilian Soybean. In addition, we have made an analysis comparing values on Moisture, Protein and Foreign Mater in February 2025 versus February 2024. We made this comparison by Country and Port/Corridor. Finally, make a weekly quality comparison on US Soybean.
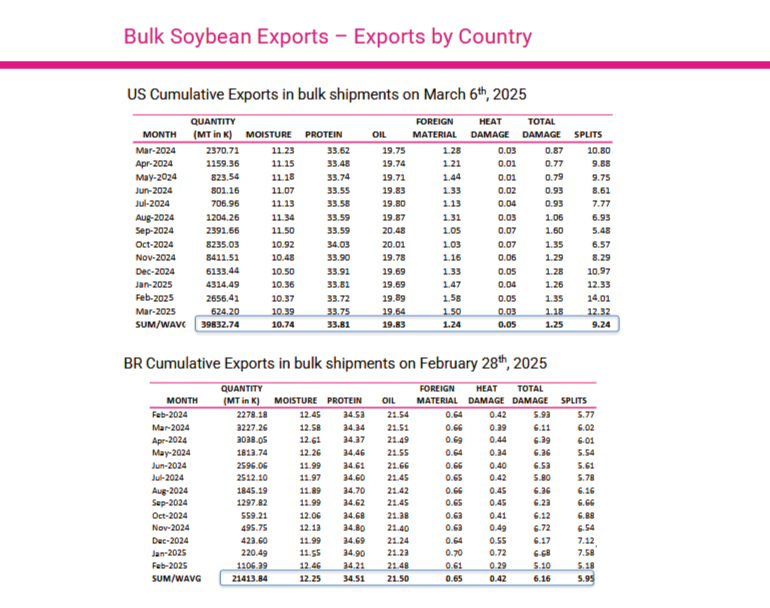
When we compare 2025/2025 shipments, Brazilian Soybean has 1.51% higher Moisture, 0.37% higher Heat Damage Kernels and 4.91% Total Damage Kernels. In addition, Brazilian Soybean has 0.70% higher Protein, 1.67% higher Oil, 0.59% lower Foreign Matter and 3.29% lower Splits.
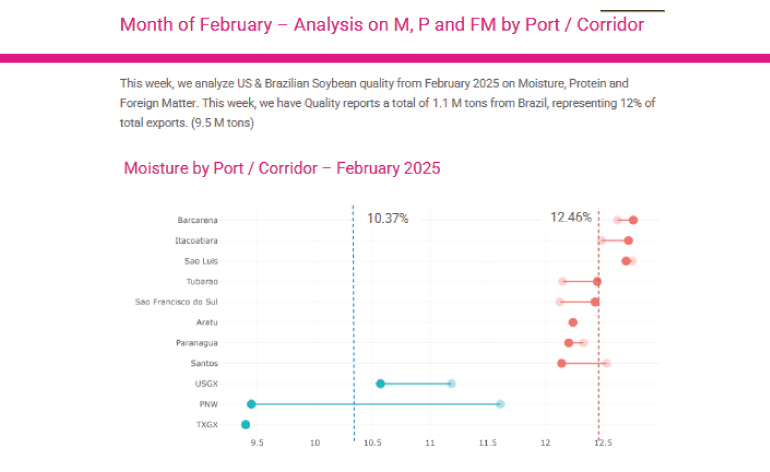
• Average Moisture of Brazilian soybean in February 2025 was 12.46% (see dotted line). Highest value was Barcarena with 12.76% and lowest value from Brazil was Santos with 12.14%
• Moisture of US soybean in February 2025 was 10.37%. Highest value was USGX with 10.57% and lowest value was TXGX with 9.40%
• Hard dots represent February 2025 values while soft dots represent February 2024 values. As we see, some values from Brazil decreased, while others increased in February 2025 compared to February 2024. In addition, we see that most values from US ports also decreased in February 2025 when compared with February 2024.
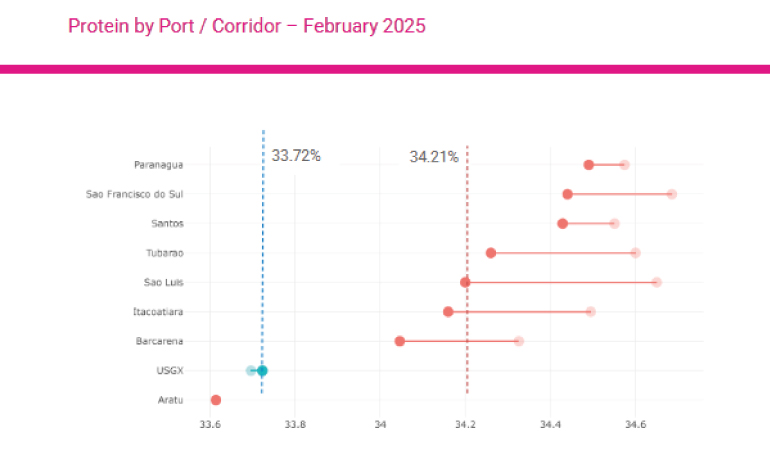
• Protein of Brazil soybean in February 2025 was 34.21% (see dotted line). Highest value was 34.49% from Paranagua and lowest value was Barcarena with 34.05%.
• Protein of US soybean in February 2025 was 33.72% (see dotted line). The only value was 33.72% from USGX .
• Hard dots represent February 2025 values while soft dots represent February 2024 values. As we see, this month, values from Brazil have decreased compared to February 2024. In addition, USGX corridor values increased 0.02% (from 33.70% to 33.72% when compared with February 2024).
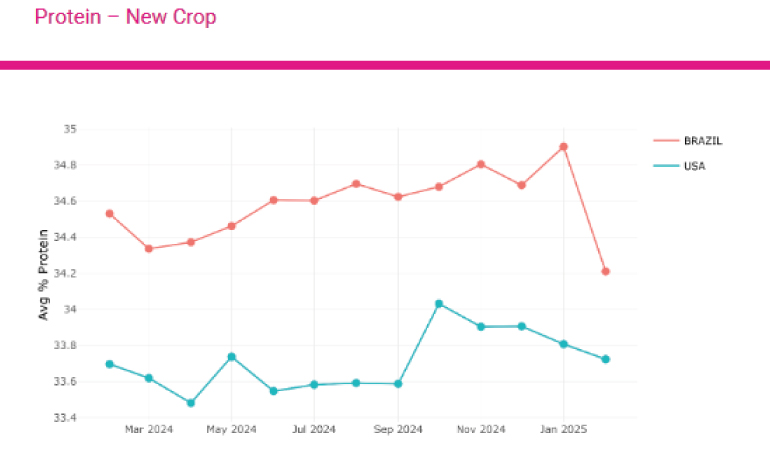
Since last week, we did not have much information from February, we took the numbers as provisory. However, this chart shows that during Feb 2025, Protein content from Brazilian soybean (34.21%) diminished in comparison to that of Feb 2024 (34.53%) and from previous month (34.9%)
We will see how this evolves.
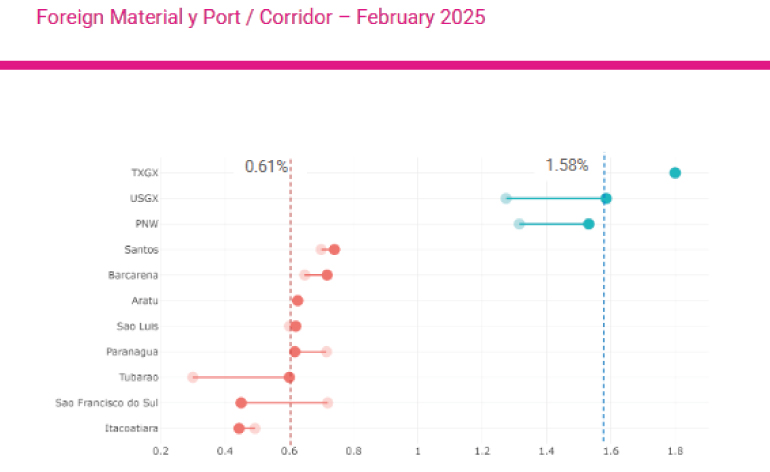
• Average FM of Brazilian soybean in February 2025 was 0.61%. Highest value from Brazil was Santos with 0.74%. Lowest value was from Itacoatiara with 0.44%
• Average FM of US soybean in February 2025 was 1.58%. Highest value from TXGX with 1.80%. Lowest value was from PNW with 1.53%
• Hard dots represent February 2025 values while soft dots represent February 2024 values. As we see, some values from Brazil increased, from February 2024 to February 2025.
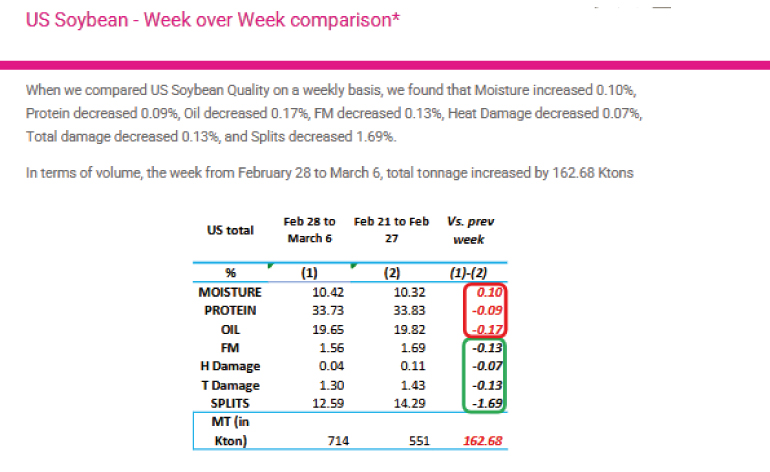
* FGIS cuts information every Thursday. Therefore, we are considering weeks from Friday to next
Thursday.
(*) Notes
For USGX, North Atlantic and TXGX, we have included only values with Oil and Oil tested. These volumes
represent a range from 39% to 96% of total volume included at the FGIS database.
For PNW corridor, since FGIS database does not show values for Oil and Oil, we have included volumes
that show values in Oil, Foreign Mater, Oil and Total Damage.
Records updated by FGIS database up to Friday of previous week.
Brazilian data based on surveyors’ analysis
US PORTS
PNW includes CALIFORNIA, COLUMBIA R. AND PUGET SOUND
USGX includes EAST GULF, MISSISIPI RIVER, SOUTH ATLANTIC
TXGX includes NORTH TEXAS
THE LAKES corridor includes TOLEDO, LAKE ONTARIO and CHICAGO
INTERIOR represents loads at the INTERIOR of the USA